
Veja também


 17.08.2026 06:35 AM
Bitcoin continues to correct and is clearly moving slowly towards the only "bearish" FVG on the daily chart. In recent weeks, the price has primarily been moving away from this pattern, and Bitcoin is signaling that it is preparing for another decline. It should be remembered that the correction can end at any moment, not necessarily within any specific pattern. Currently, there are no signs that the bearish trend, which began last year, is coming to an end. The fundamental backdrop also remains negative for the cryptocurrency segment: the Federal Reserve does not intend to lower the key rate in 2026, capital continues to flow into the AI sector, spot demand for Bitcoin remains weak, geopolitical tensions are unstable, miners are repurposing their equipment for AI needs, and strategy continues selling Bitcoin reserves. We see no reason for a strong rise in "digital gold."
Meanwhile, experts have reported that it will take over 100 years to mine the remaining one million Bitcoins. Many traders and experts associate regular "halvings" with the growth of "digital gold," believing that the reduction in miner rewards every four years is a growth factor. In our view, it is quite the opposite. The continuous decrease in mining rewards without a rise in Bitcoin value makes mining unprofitable. The "halving factor" alone does not justify mandatory price doubling every four years.
Simply put, Bitcoin is not obligated to grow in price by at least two times each cycle just because of "halving." The price can only rise if demand consistently exceeds supply. However, "halvings" are inevitable and reduce miner incomes every four years. Thus, in the absence of continuous growth, interest in mining new Bitcoins declines, which in turn decreases investor interest in "digital gold." Therefore, we believe that in the long term, Bitcoin is unlikely to be on a course toward $1 million, but rather will hover in ranges disconnected from new ATHs for years.
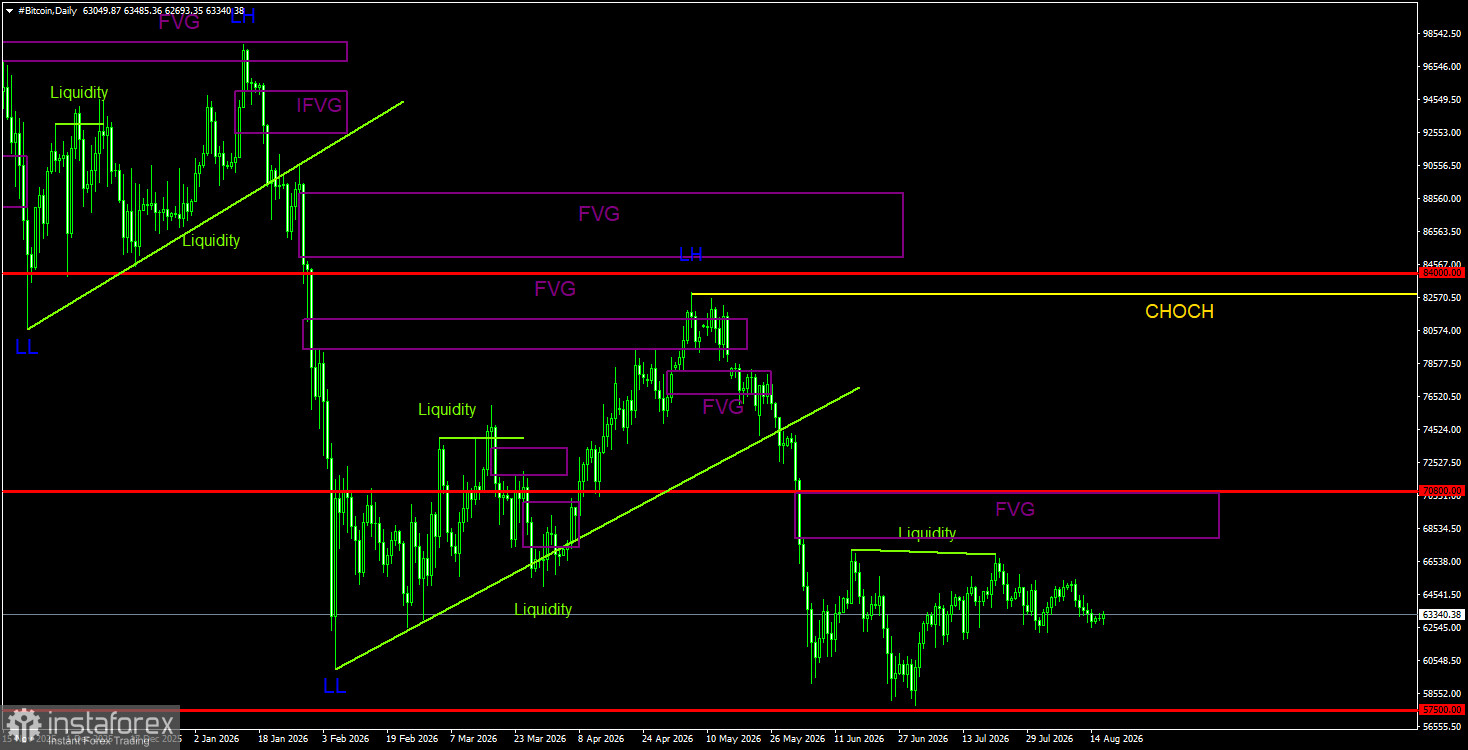
On the daily timeframe, Bitcoin continues to form a downtrend. The trend structure is bearish, with the CHOCH line at $82,800, and a new LL (Lower Low) has been formed. Only above this level can it be considered that the downtrend has ended. Since there are still no signs of a trend reversal to the upside, we believe the decline will resume once the current correction is over. On the daily timeframe, a bearish FVG has formed in the $68,000 - $70,700 range, making it the only POI area for sales. Additionally, around this pattern, there is a liquidity pool consisting of two nearly equal highs. The execution of the FVG may coincide with the removal of liquidity, strengthening the sell signal.
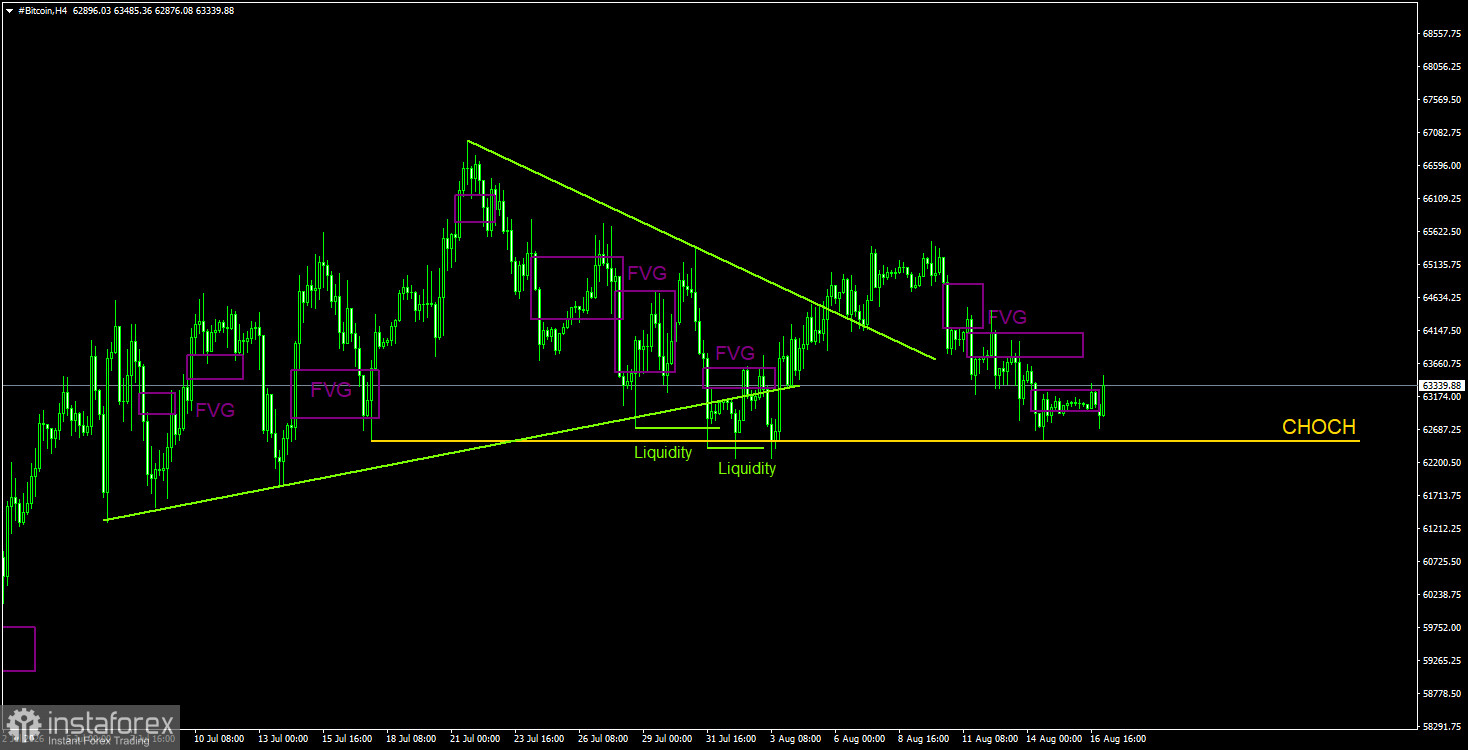
On the 4-hour timeframe, Bitcoin continues to form a rising corrective trend. The CHOCH line, which supports the upward trend, has not been broken and lies at $62,500. A consolidation below this will indicate the completion of the latest corrective wave. Liquidity above the trend line has been gathered, so the current decline is entirely justified. Last week, three bearish FVGs were formed; the price reacted to the first two, and now it is at the CHOCH line. The reaction to the last FVG has been practically absent, so Bitcoin may show slight growth at the beginning of the new week.
Bitcoin continues to form a full downtrend. We continue to expect a decline targeting $57,500 (the 61.8% Fibonacci level of the three-year uptrend), even though this level has essentially already been reached. However, we do not believe that the downtrend will end here. The last bearish FVG pattern formed in the $68,000 - $70,700 area on the daily timeframe; therefore, this area serves as a POI for short positions in the coming weeks. On the 4-hour timeframe, Bitcoin is once again inclined to fall, but most likely, the movements will remain choppy and "swingy." Traders can consider trade options based on local patterns, but we would not anticipate strong movements at this time.
CHOCH – break of trend structure.
Liquidity – liquidity, stop-loss, and pending orders that market makers use to build their positions.
FVG – price inefficiency area. Price moves through such areas very quickly, indicating a complete absence of one side in the market. Subsequently, price tends to return and react to such areas in continuation of the main trend.
IFVG – inverted price inefficiency area. After returning to such an area, the price does not react to it; instead, it breaks through impulsively and then tests it from the opposite side.
OB – Order block. A candle in which the market maker opened a position to gather liquidity to form their own position in the opposite direction.


