Veja também

 25.03.2026 07:31 AM
Bitcoin has fallen for 7 consecutive days, and an upward correction remains on the daily timeframe, with a somewhat flat pattern on the 4-hour timeframe. The US President stated on Monday that successful negotiations with Iran have taken place, leading to a five-day postponement of the ultimatum concerning strikes on energy infrastructure. Bitcoin experienced a slight surge in optimism following this event, but nothing has fundamentally changed. Therefore, traders can still expect sluggish growth, bordering on a "flat" situation. Most patterns on the 4-hour timeframe are being ignored, which further indicates a flat. On the daily timeframe, there are no new patterns, and those that are already present on the chart cannot be executed by Bitcoin.
If the war in the Middle East ends, it may temporarily support "digital gold." However, it is unlikely to last long or be substantial. In our opinion, the market is preparing for a new decline that will be much lower than the trend line on the daily timeframe. The $57,500 target remains unfulfilled, and we still do not see any signs that the downward trend is ending. The Fed worsened the fundamental backdrop for the cryptocurrency market last week, ruling out any further monetary policy easing for an indefinite period. Traders expect the key rate to be reduced again by the end of the year, but how can we forecast the end of the year when it is unknown what will happen tomorrow?
One thing is clear: the current movement is a correction, and there are still quite obvious targets below for Bitcoin, while investors are hesitant to buy "digital gold," despite the attractiveness of current prices and assurances from Michael Saylor, Robert Kiyosaki, and Cathie Wood.
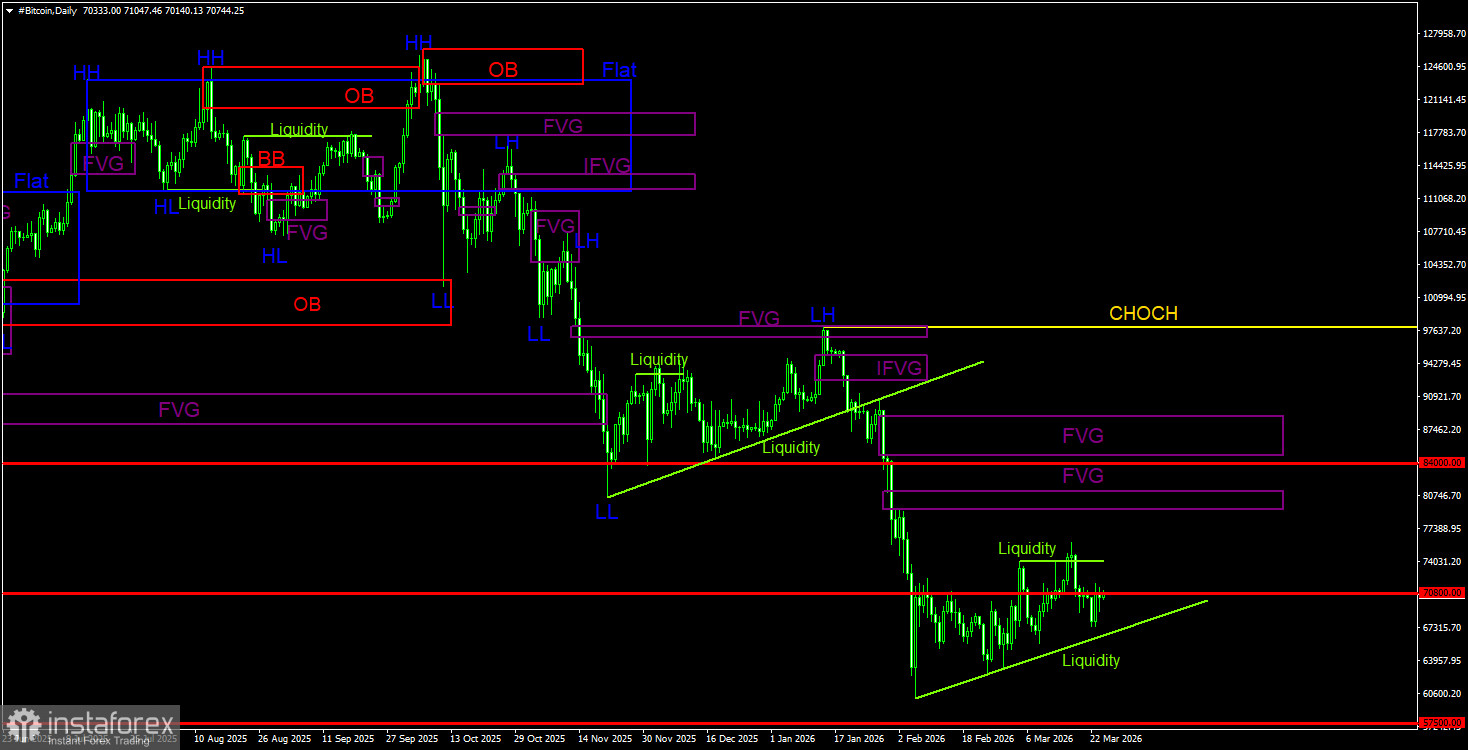
On the daily timeframe, Bitcoin continues to form a downward trend. The trend is downward, and the CHOCH line currently sits at $97,900. Only above this level can we consider the downward trend to have concluded. Recall that the last sell signal was formed within a "bearish" FVG ($96,900 – $98,000). Thus, traders had a wonderful opportunity to capture nearly the entire last downward movement. The relevant target for the decline remains at $57,500 – 61.8% on Fibonacci. Given no signs of a trend reversal to the upside, we believe the decline will continue. On the daily timeframe, the nearest area of POI for new sell trades is in the range of $79,500 – $81,100.
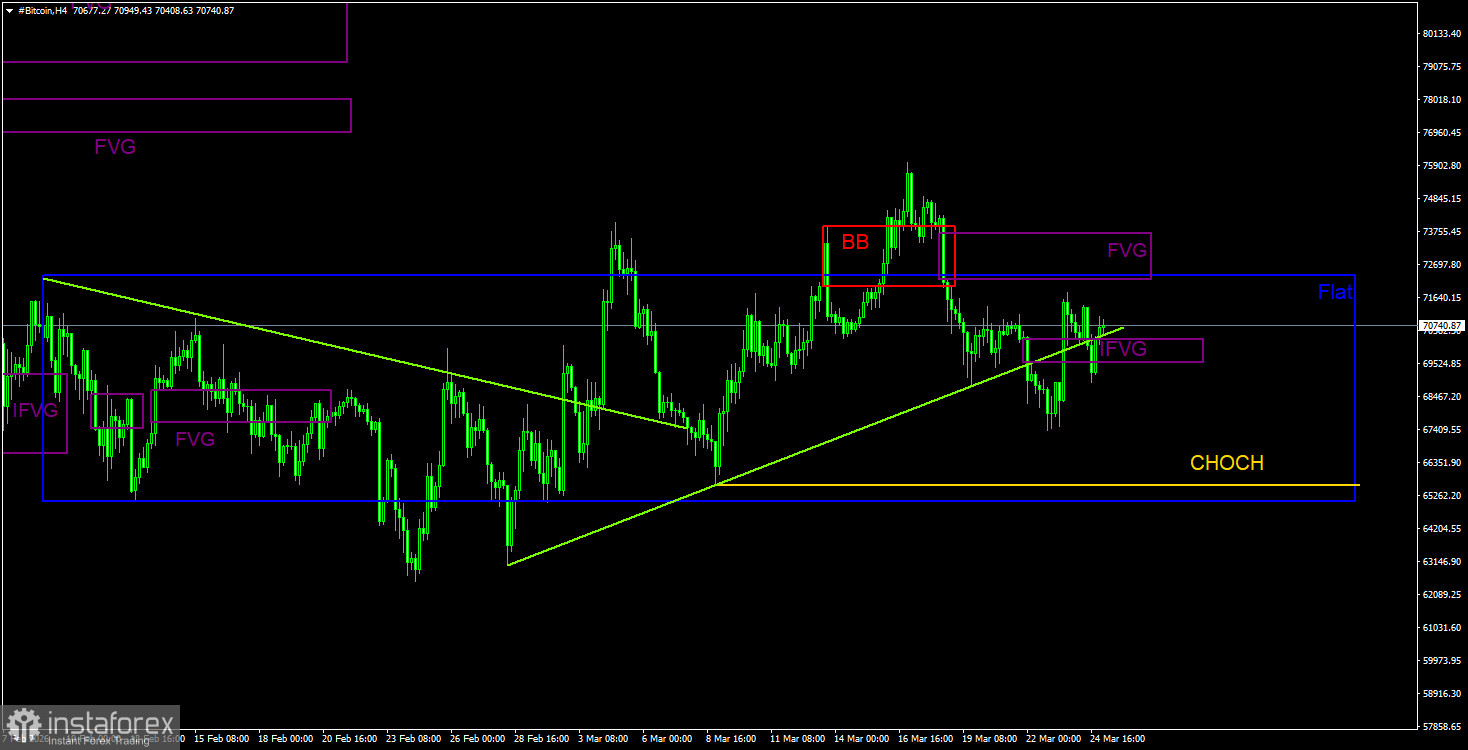
On the 4-hour timeframe, the price has completed a 5-week flat, but no trend has started yet. The CHOCH line, which provides support for the upward correction, is at $65,500. Breaking through this line will indicate the completion of the correction that has lasted for more than a month. The order block was impulsively broken, and the breaker block was also impulsively broken, but no signals were formed; thus, the flat cannot be considered relevant at this time, and the short-term upward trend cannot be considered finished, as the bearish sentiment in the market persists. The last bearish FVG was canceled after Trump's speech, and the IFVG formed on its basis also did not elicit a tangible reaction.
Bitcoin continues to form a full-fledged downward trend. We continue to expect a decline to $57,500 (the 61.8% Fibonacci level from the three-year upward trend), and there are currently no signs of a trend reversal. However, even the level of $57,500 does not now appear to be a final stopping point. Among the POI areas currently, only the nearest bearish FVG on the daily timeframe, which is positioned quite far from the price, can be highlighted. On the 4-hour timeframe, Bitcoin's movement shows all the signs of a flat. An obvious target remains below—the liquidity pool beneath the trend line on the daily timeframe.
CHOCH – Change of Trend Structure.
Liquidity – The liquidity, or Stop Loss, of traders that market makers use to build their positions.
FVG – Area of Price Inefficiency. The price moves quickly through such areas, indicating a complete absence of one side in the market. Subsequently, the price tends to return and react to such areas.
IFVG – Inverted Area of Price Inefficiency. After returning to such an area, the price does not react but impulsively breaks through it and then tests it from the other side.
OB – Order Block. The candle on which the market maker opened a position to take liquidity to form their position in the opposite direction.


