Veja também

 18.12.2025 07:11 AM
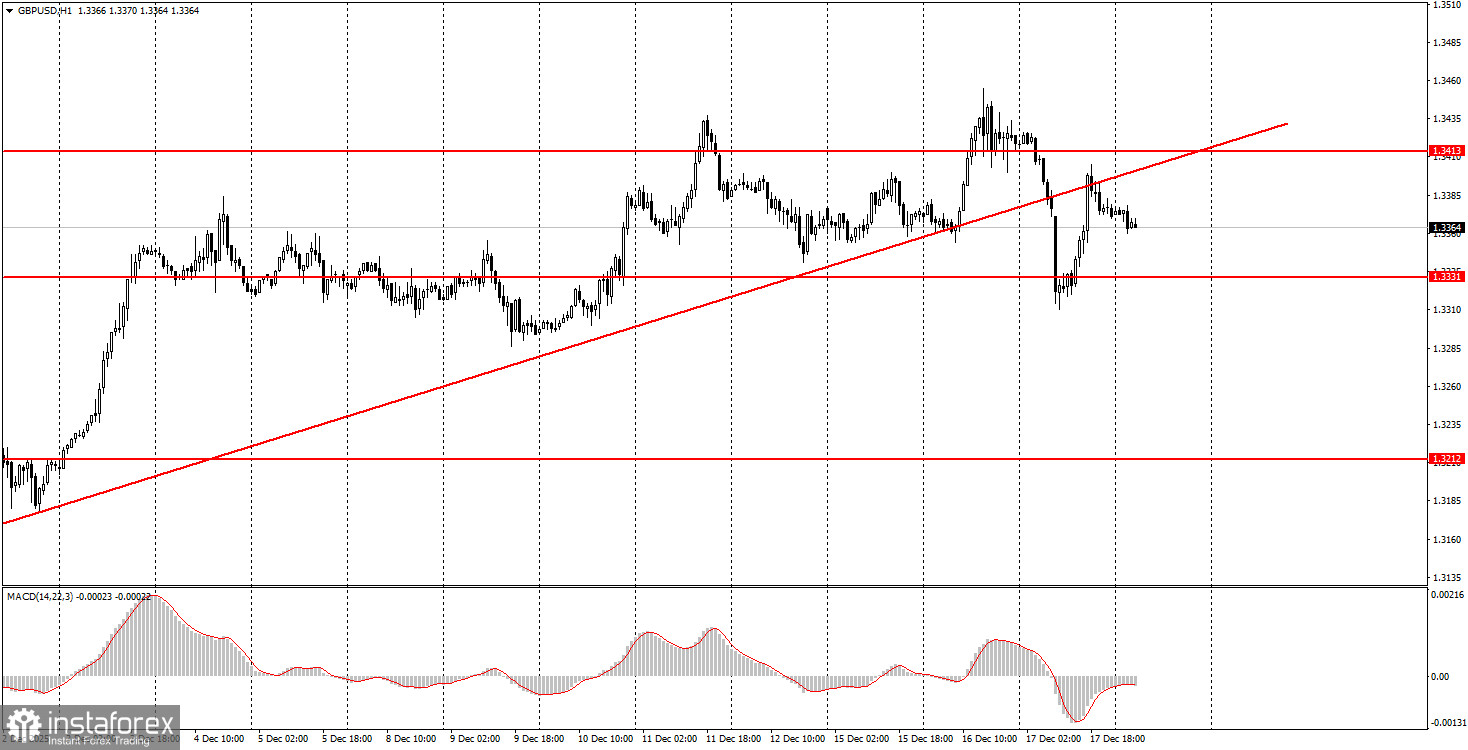
The GBP/USD pair experienced a sharp decline on Wednesday, recovered, and then resumed a new downward move. The ascending trendline has been broken, so a correction may occur in the near future. Yesterday, the UK inflation report was published, providing a definitive conclusion on the Bank of England's monetary policy decision scheduled for today. There is now no doubt that the British central bank will cut the key interest rate, which is a bearish factor for the British currency. While this decision may already be partially priced in, a decline could still be observed today, as the BoE may adopt a more dovish stance in 2026 than the market expects. Additionally, U.S. inflation remains one of the most significant indicators. Reports on the U.S. labor market for November were quite contradictory, but we would label them as largely negative. Therefore, a decline in U.S. inflation could lead to a drop in the dollar as the market anticipates further Federal Reserve easing. Traders can expect another busy day today, and volatility is likely to remain high.
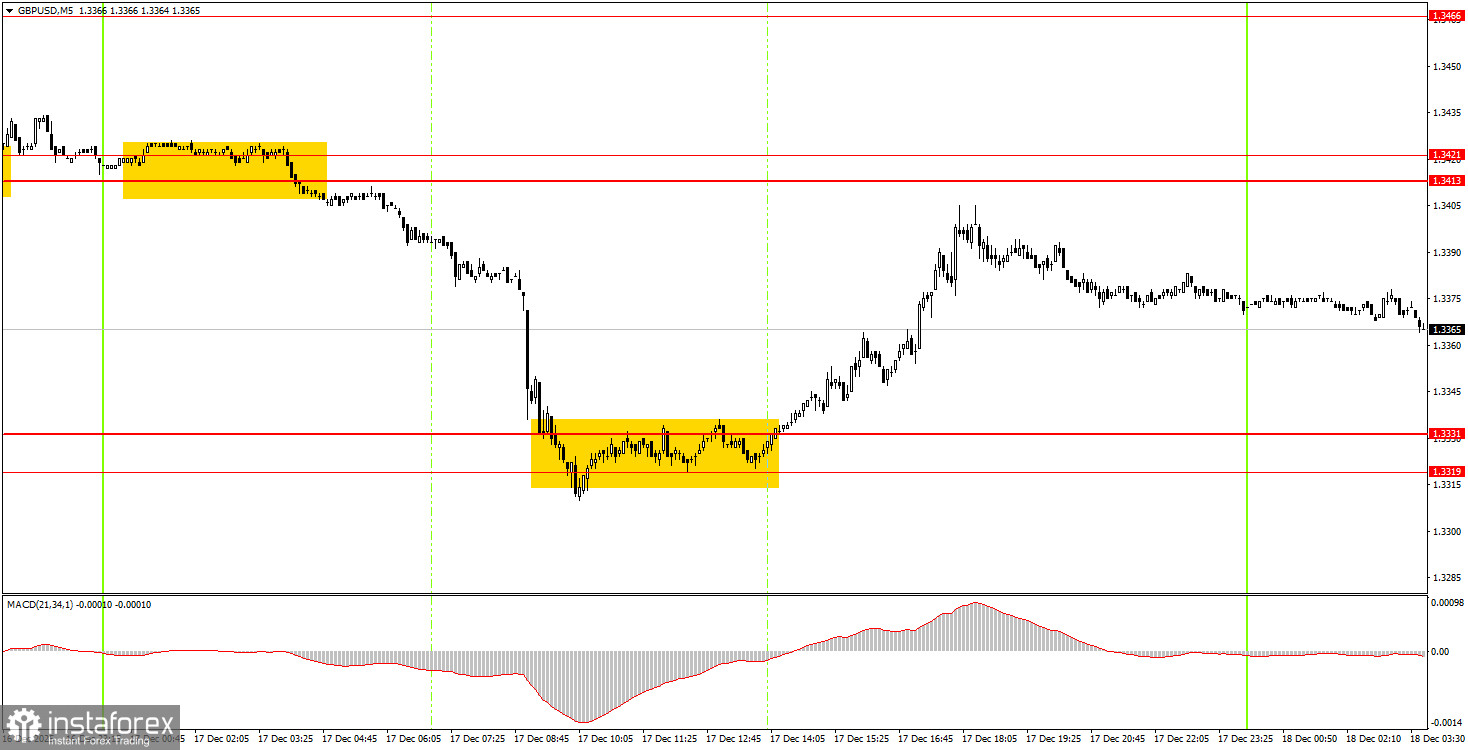
On the 5-minute timeframe, two solid sell signals were formed throughout Wednesday. As soon as the pair started moving less sluggishly, strong signals began to appear. Early in the Asian trading session, the price bounced from the 1.3413-1.3421 area, and by the time of the European open, it had barely moved away from the pivot point. Thus, novice traders could open short positions. Within just an hour, the 1.3319-1.3331 range was tested, and the pair failed to break through. A buy signal was generated, yielding profits.
On the hourly timeframe, the GBP/USD pair may enter a downward correction since the trendline has been broken. As mentioned, there are no global foundations for medium-term dollar growth, so we expect movement only to the upside. Overall, we anticipate a resumption of the global upward trend for 2025, which could lead the pair to the 1.4000 level within the next couple of months.
On Thursday, novice traders may consider new long positions if the price bounces from the 1.3319-1.3331 area, targeting the 1.3413-1.3421 range. If this area is breached, short positions will become relevant, with targets at 1.3259-1.3267.
On the 5-minute timeframe, levels to consider include 1.2913, 1.2980-1.2993, 1.3043, 1.3096-1.3107, 1.3203-1.3212, 1.3259-1.3267, 1.3319-1.3331, 1.3413-1.3421, 1.3466-1.3475, 1.3529-1.3543, 1.3574-1.3590. Wednesday sees the announcement of the BoE meeting results in the UK, and in the U.S., the inflation report will be published. Both events are crucial and could provoke a strong market reaction.
Important Note: Significant speeches and reports (always included in the news calendar) can greatly influence the movement of the currency pair. Therefore, during their release, it is advisable to trade cautiously or exit the market to avoid sharp reversals against the preceding movement.
Remember: For beginners trading in the Forex market, it is important to understand that not every trade can be profitable. Developing a clear strategy and practicing money management are keys to long-term trading success.


