Veja também

 06.05.2026 05:55 AM
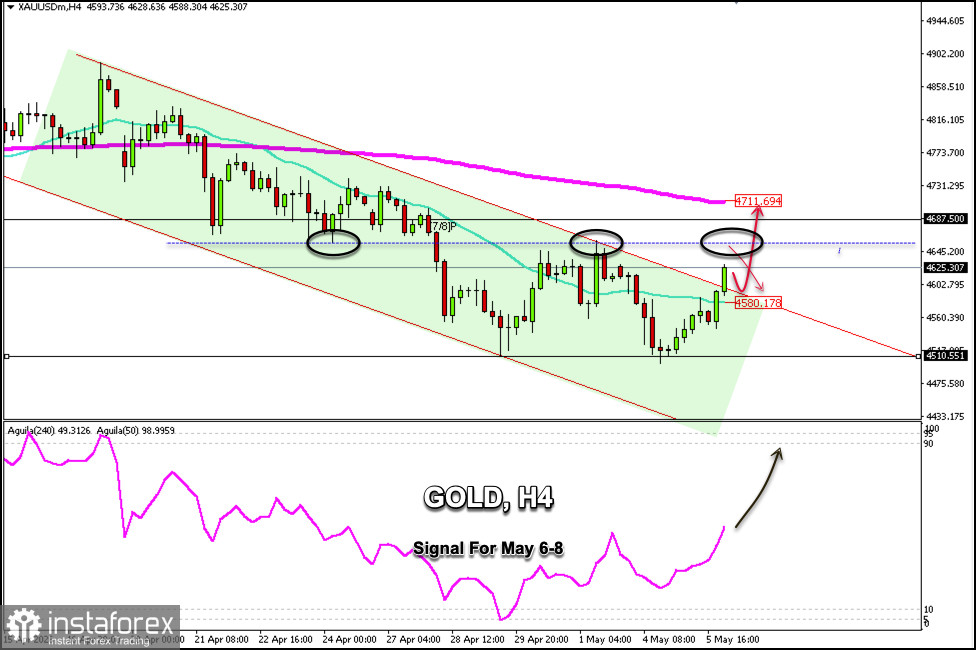
After forming a double bottom pattern around $4,510 and hitting a low of $4,501 during Monday's US trading session, gold is going on with its technical rebound. On the H4 chart, we now see a decisive break above the uptrend channel.
If the gold price consolidates above $4,600 in the coming days, this could be seen as a positive signal to buy, with targets at $4,687 and ultimately at the 200 EMA around $4,711.
According to the H4 chart, gold is breaking out of the bearish trend channel formed since April 16, and we could expect it to reach the daily R_2 around $4,650. After reaching this zone, we could see a technical correction toward the $4,580 area; or, above this zone, we could buy with targets at $4,687 and $4,700.
If the instrument returns and consolidates below the uptrend channel and below the 21 SMA around $4,580, the bearish cycle could resume, potentially reaching the key support at $4,510 and possibly even hitting the 6/8 Murray level at $4,375.
Given that gold has formed a double-bottom technical reversal pattern, it is expected to continue rising in the coming days and could reach the 200 EMA at $4,711 and even return to the April 16 price levels around $4,870.
You have already liked this post today
*A análise de mercado aqui postada destina-se a aumentar o seu conhecimento, mas não dar instruções para fazer uma negociação.


