Lihat juga

 24.12.2025 05:18 AM
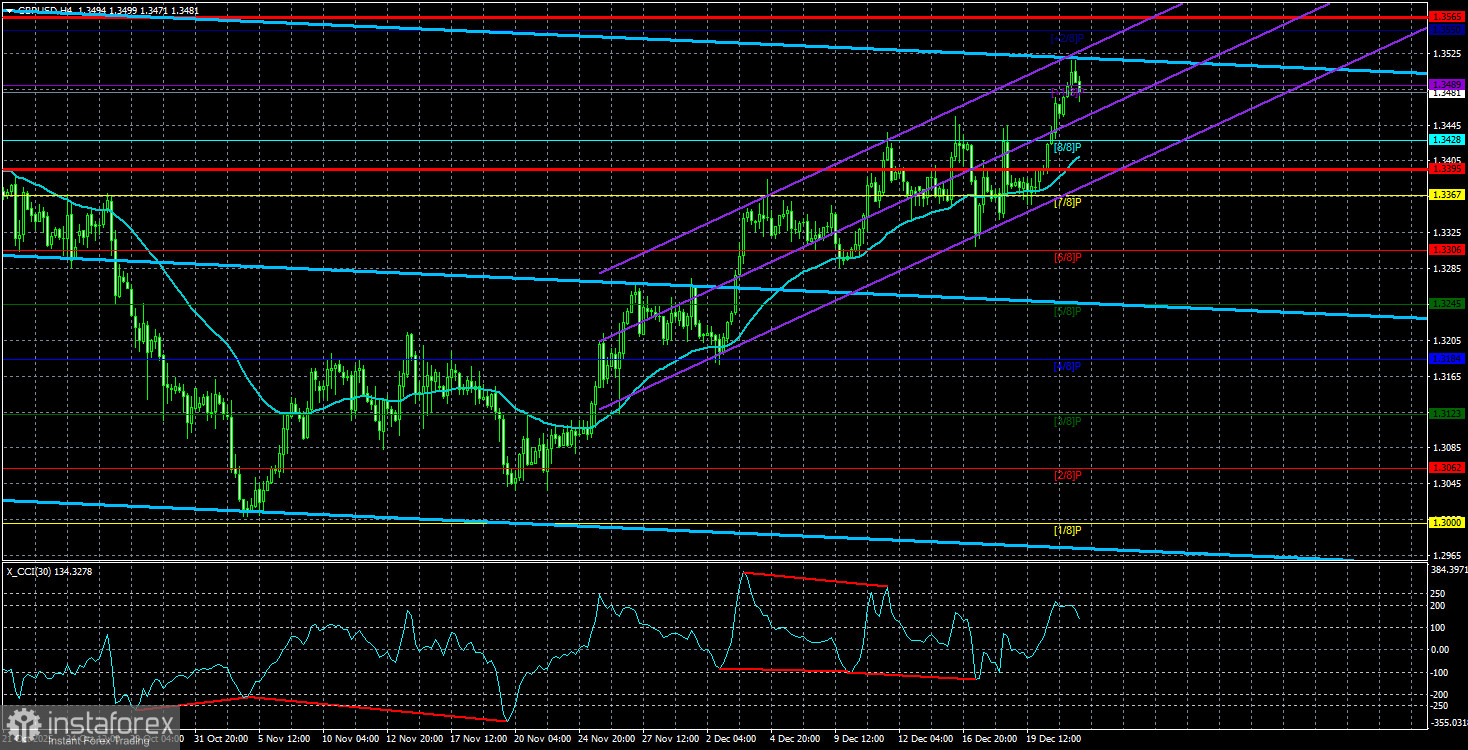
The GBP/USD currency pair continued its upward movement for most of Tuesday. It is worth noting that on the second trading day of the week, three relatively important events were scheduled: US GDP, industrial production, and durable goods orders. However, one can immediately question the likelihood of a strong market reaction to these reports, especially since the previous week we saw virtually no movements during much more significant events and reports. Moreover, from the start of the trading week on Monday night until the release of US data on Tuesday, the British currency had already appreciated by 130 pips. This occurred during a holiday week and amid a complete absence of important news.
The reason is that the dollar has exhausted its luck. This fall, the British currency dropped for any reason. It was particularly amusing to see the pound fall time and again during UK Chancellor Rachel Reeves's speeches, even when she spoke about the weather. The UK's budget issues were priced in by the market multiple times, while Democrats and Republicans in the US could not agree on their 2026 budget. Only in the UK did things proceed without a "shutdown," whereas in the US, it lasted for a month and a half. Yet during this time, the dollar was rising.
In terms of the broader fundamental backdrop, nothing has practically changed for the dollar in the second half of 2025. Donald Trump enacted new tariffs in the early fall, the Federal Reserve's monetary policy continues to ease, and the US president has not wavered from his goal of taking control of the Fed. The trade war continues, and the labor market is responding significantly to the new administration's decisions. Yes, the Bank of England will also lower its key rate next year, but the pound faces only easing monetary policy, while numerous bearish factors beset the dollar.
From a technical perspective, the GBP/USD pair has broken through the Senkou Span B line on the daily timeframe of the Ichimoku indicator with standard settings. This is a very important moment signaling a change in trend. On the daily chart, even novice traders can easily see a three-wave correction—textbook classic. We have consistently stated that any dip in the pair is merely a correction, and now we are even more convinced of this.
The CCI indicator has grown weary over the past few months of entering the oversold area and drawing "bullish" divergences. Such signals during an uptrend indicate one thing—an impending resumption of the upward trend. During the holiday season, the market is "thin," which makes it much easier for market makers to move prices in the desired direction. Not every holiday season is accompanied by trending movements, but this year appears to be one of those rare exceptions.

The average volatility for the GBP/USD pair over the last five trading days stands at 85 pips, which is considered "average" for this pair. On Wednesday, December 24, we expect movements within the range limited by the levels of 1.3395 and 1.3565. The upper linear regression channel is directed downwards, but this is only due to a technical correction on higher timeframes.
The CCI indicator has entered the oversold area six times over the past months and has formed numerous bullish divergences, consistently signaling a potential resumption of the upward trend. Last week, the indicator formed yet another bullish divergence, further indicating the likelihood of renewed growth.
The GBP/USD pair is attempting to resume its upward trend for 2025, and its long-term prospects remain unchanged. Donald Trump's policies will continue to put pressure on the dollar, so we do not anticipate growth from the US currency. Therefore, long positions targeting 1.3550 and 1.3565 remain relevant for the near future as long as the price is above the moving average. If the price is below the moving average line, small short positions can be considered targeting levels of 1.3367 and 1.3306 on technical grounds. From time to time, the US currency shows corrections on a global scale, but for a strengthening trend, it needs signs of the conclusion of the trade war or other global positive factors.


