
यह भी देखें


 05.08.2026 07:48 AM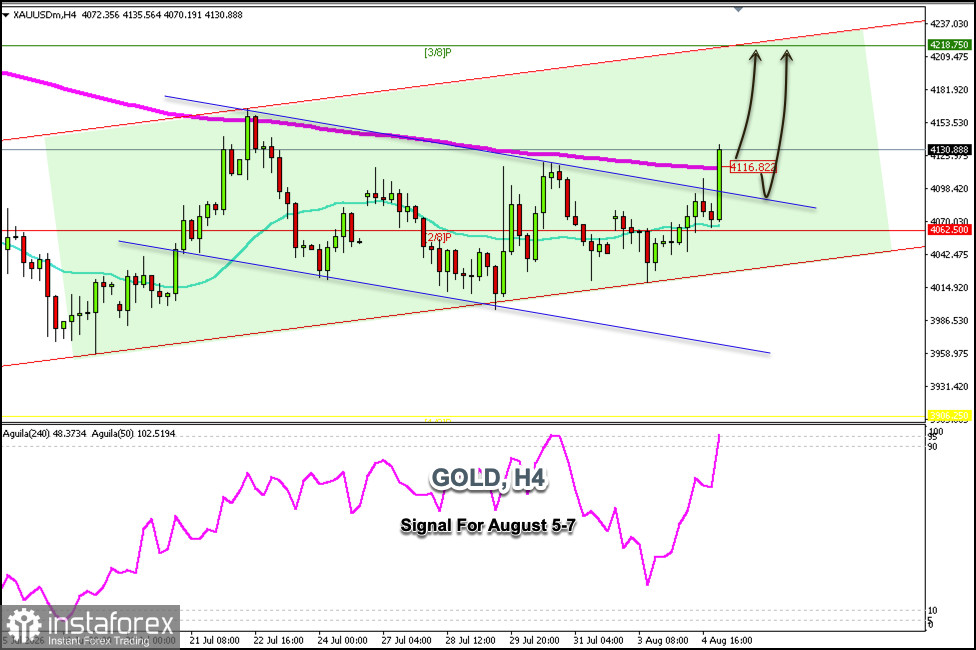
Gold is trading around $4,130, above the downtrend channel formed since July 22 and within the uptrend channel formed since early July, showing a positive bias.
On the H4 chart, we can see that gold has decisively broken out of the downtrend channel and is also consolidating above the 200-period moving average, so it is likely to continue rising in the coming days and could reach the 3/8 Murray level around $4,218.
If gold falls to the upper band of the downtrend channel around $4,080, we could expect a technical bounce, which could be considered an opportunity to open long positions in anticipation of it reaching the upper band of the uptrend channel at $4,220.
Given that gold is showing a positive signal, we could look for opportunities to buy above the 200-day moving average around $4,116 or, in case of a pullback toward the resistance level that was broken around $4,080, to open long positions.
Conversely, a drop below $4,080 could trigger a technical correction toward the lower band of the uptrend channel around $4,040.
The Eagle indicator is reaching overbought levels, so we should be cautious if gold encounters resistance around $4,140; we could expect consolidation below this zone over the next few hours.
You have already liked this post today
*यहां पर लिखा गया बाजार विश्लेषण आपकी जागरूकता बढ़ाने के लिए किया है, लेकिन व्यापार करने के लिए निर्देश देने के लिए नहीं |

