See also

 24.03.2026 01:39 PM
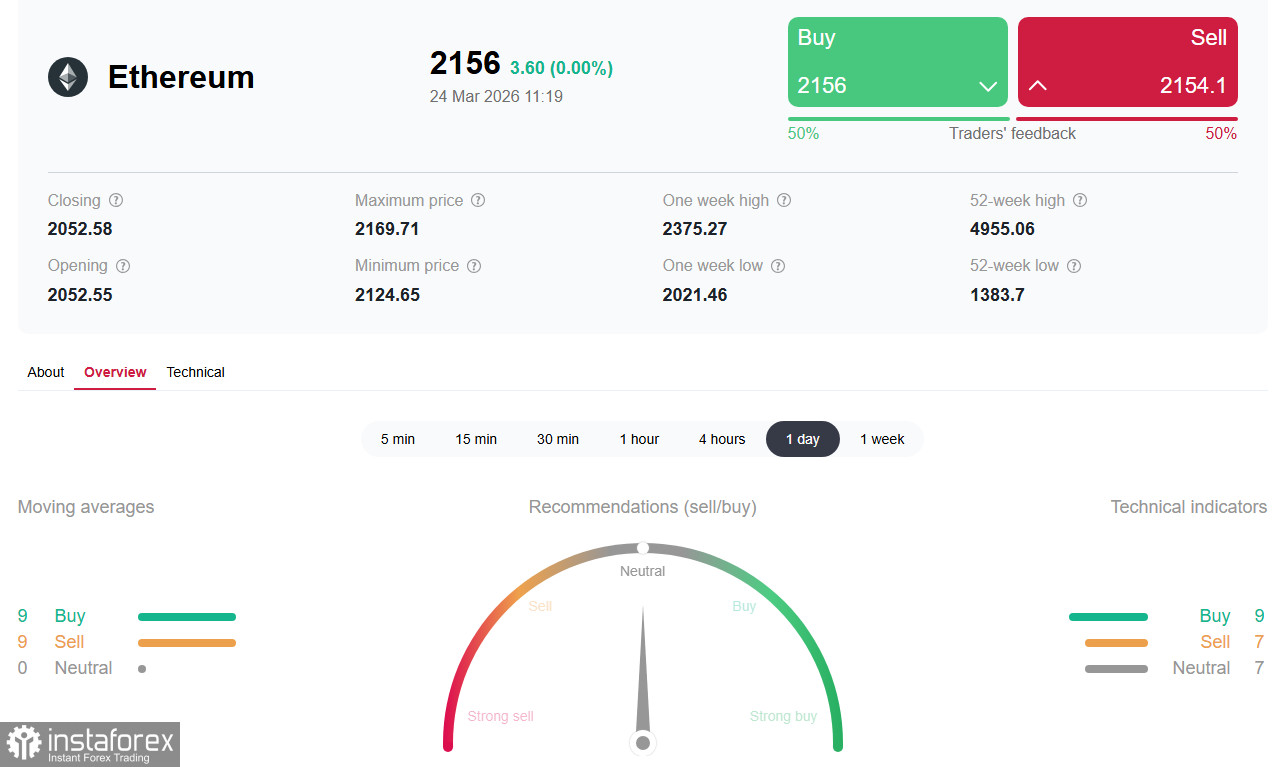
See also: InstaTrade trading indicators for ETH
Frozen in uncertainty, the ETH/USD pair is consolidating around 2100.00–2160.00, while Bitcoin holds above the psychological level 70000.00 ahead of the opening of the US trading session on Tuesday. The market, and the crypto market in particular, has found itself at the epicenter of a clash of opposing forces: on one side, a geopolitical pause that has provided a temporary breather; on the other, worrying technical signals that point to the risk of a deep correction.
Current situation: geopolitical pause without clarity
On Monday, US President Donald Trump announced a five-day postponement of strikes on Iranian energy infrastructure, calling the recent talks very good and productive. This statement triggered a sharp weakening of the dollar and a short-term rise in cryptocurrencies: bitcoin exceeded 71000.00, and ether rose above 2180.00.
However, the euphoria proved short-lived. Iranian agency Fars News denied direct communications with the US, stressing readiness for retaliatory attacks on the energy infrastructure of Persian Gulf countries. Saudi Arabia and the UAE, in turn, granted the Pentagon access to their military bases, which could contribute to escalation.
The key problem — the Strait of Hormuz, through which about 20% of global oil supplies pass — remains effectively blocked. Economists warn that, if the situation is not resolved in the coming weeks and months, this will lead to an even greater negative shock to energy prices and to the global economy.
Institutional demand: light and shadow
Fresh data on ETF flows indicate a decrease in institutional appetite. On March 24, BlackRock recorded outflows from its Ethereum ETF totaling $15.7 million, according to open sources. Historically, such outflows correlate with pressure on the ETH price and often serve as a barometer of retail investor sentiment.
However, there are positive signals as well. The largest holders of Ethereum, whales, have returned to profitability for the first time in several months—historically, this is a strong precursor to a sustainable bull cycle. Thus, Bitmine Immersion Technologies, affiliated with Fundstrat, purchased an additional 65,341 ETH for $141.8 million, increasing its total holdings to 4.66 million ETH worth over $10 billion.
Despite ETF outflows, Ethereum's fundamental metrics remain resilient: transaction volumes and gas fees continue to show active network usage. This divergence between on-chain activity and price action often precedes significant moves.
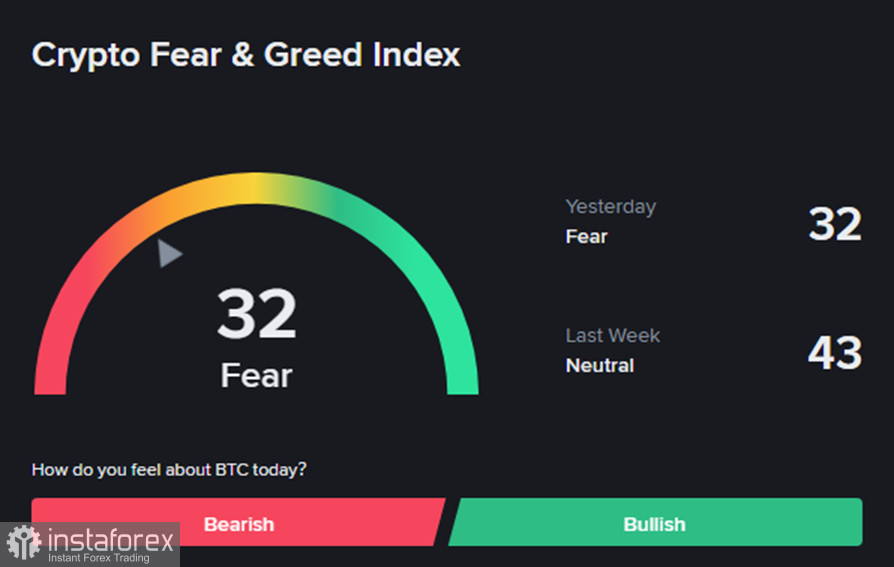
The crypto market fear and greed index today remains in the fear zone at 32 (out of 100), while the overall investor fear and greed index, although it rose to 16 points, remains in the extreme fear zone.
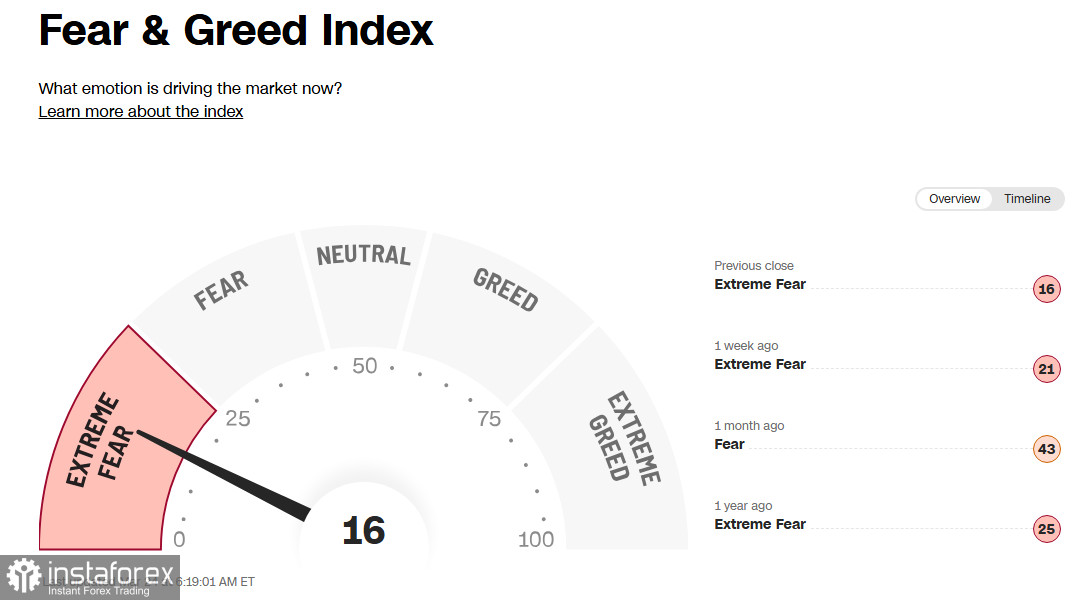
Historical Glassnode data show that buying bitcoin when the index falls below 25 delivered a median 90-day return of about +38% across 23 instances since 2020.
As Chainalysis notes, a low fear and greed index is not, by itself, a buy signal, but combined with strong on-chain fundamentals, it can indicate high-potential investment opportunities.
Fed factor: hawkish pause remains
Additional pressure on the crypto market is exerted by the Fed's persistent hawkish stance. Last week, the regulator kept the policy rate in the 3.50–3.75% range, hinting at a decision to forgo adjustments in the medium term due to unclear inflation prospects. Prolonged maintenance of high rates remains a negative signal for risky assets.
Fed Chair Jerome Powell indicated that rate cuts will not follow if progress in the fight against inflation stalls and that rising oil prices due to the war in Iran will boost inflation in the short term.
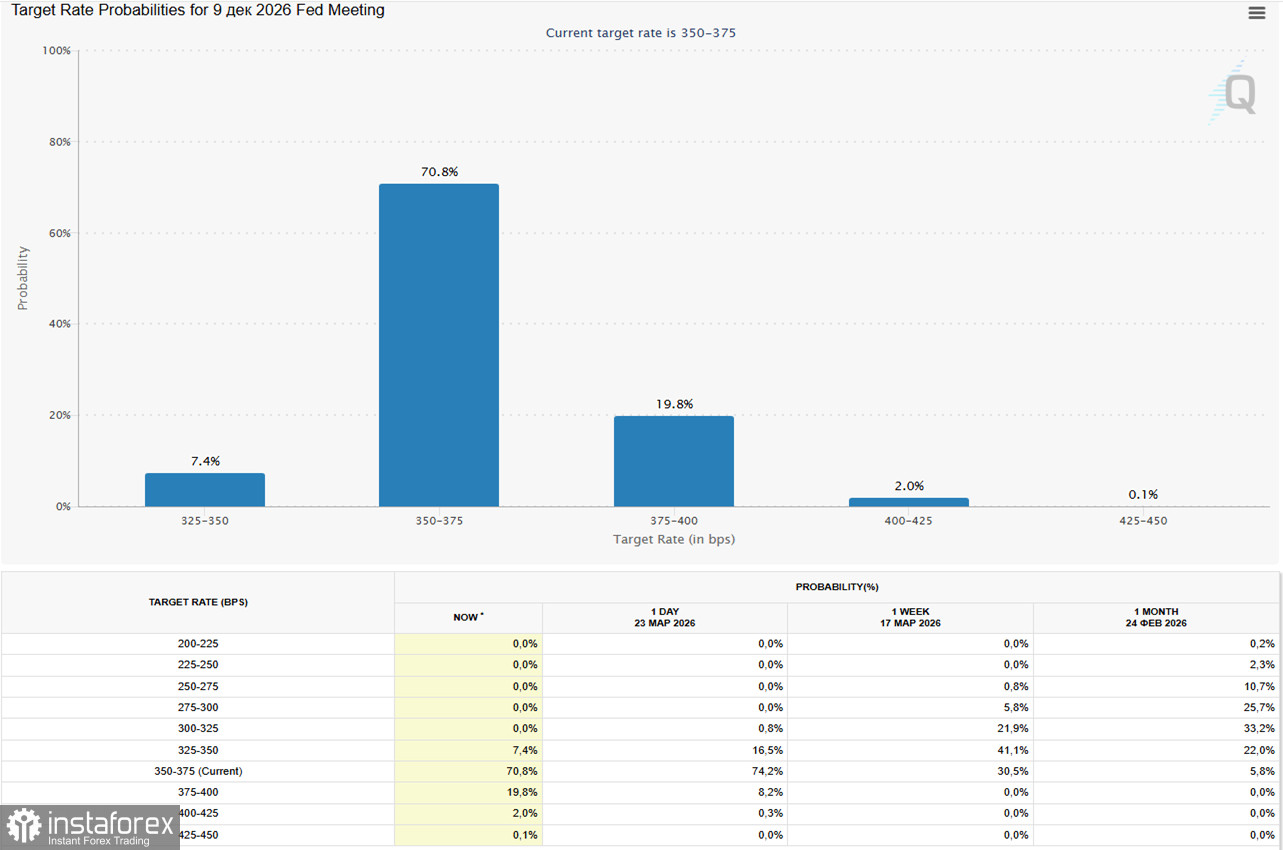
According to the CME FedWatch tool, the probability that the Fed will hold rates at the current level through December is roughly 70%. This creates fundamental support for the US dollar.
An additional factor strengthening the dollar was recent US producer price index (PPI) data for February, which were significantly above expectations: headline PPI rose by 0.7% month on month (against a forecast of 0.3%), and the annual rate accelerated to 3.4%. This heightened concerns about inflation persistence, as we noted in our recent review, "USD/CHF: dollar versus a 'safe haven' with central bank support."
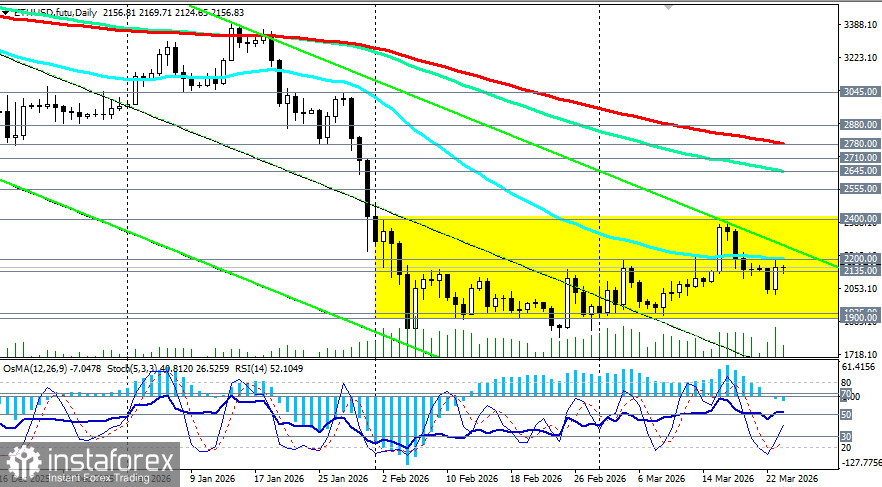
Brief technical analysis
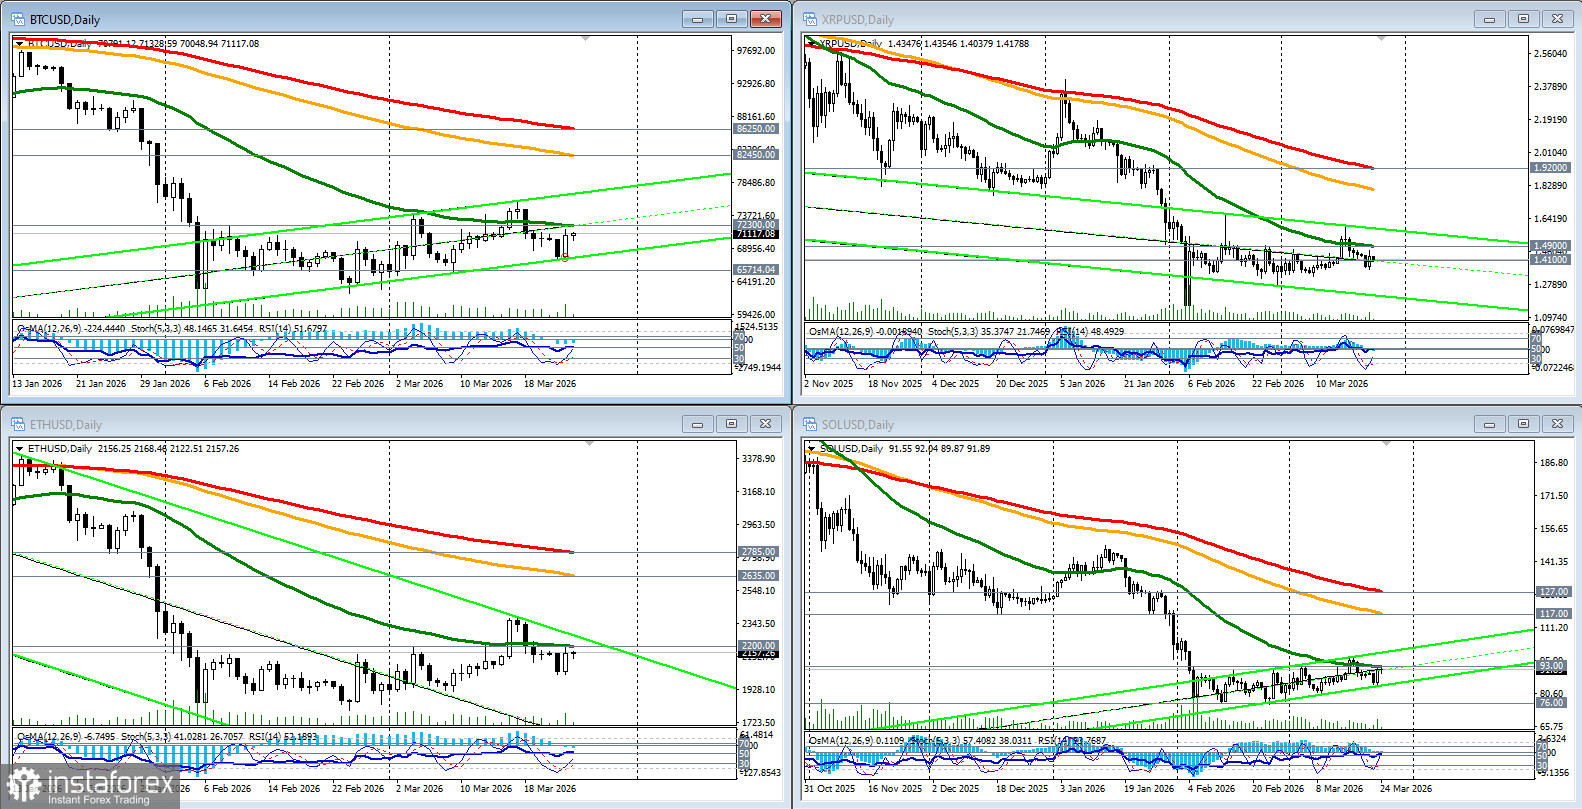
ETH/USD continues to move within the main sideways range 2200.00 (EMA50 on the daily chart)–1935.00 (EMA200 on the monthly chart).
Technical indicators do not provide a unified signal:
· RSI(14) on the daily chart at 52 signals the possibility of continued upside correction.
· The OsMA histogram has moved into the sell zone.
· The stochastic on the daily chart (at 40) has turned up from the sell zone toward buy territory—a potential buy signal. A cross upward through the 50 level would be a confirming signal for buyers, given additional confirmations—the current trend, other indicators, fundamental factors, etc.
Still, note an important aspect: quotes remain in a long-term downtrend, and all major moving averages (50-, 144-, and 200-period) on the daily chart are pointing down, confirming the persistence of the medium-term downtrend. The current state within a downtrend makes continuation of negative dynamics more likely.
Conclusion
The short-term geopolitical pause provided a temporary breather, allowing crypto prices to bounce off lows, but the technical structure is sending warning signals. The question is not whether the low will be broken, but when it will be broken, crypto market experts say.
One more important point. Today, more than $2.1 billion in BTC and ETH options expire, which almost coincides with the large-scale Triple Witching event on Wall Street, totaling $5.7 trillion.
Although such expirations do not directly determine market direction, they amplify existing dynamics. In this case, the technical structure points to a downward move, which may accelerate the decline.
For reference. The Triple Witching on Wall Street (or the Triple Witching Hour) is the final hour of the trading session on the third Friday of March, June, September, and December, when most index futures, index options, and single-stock options expire. On these days, trading volume and market volatility typically spike.
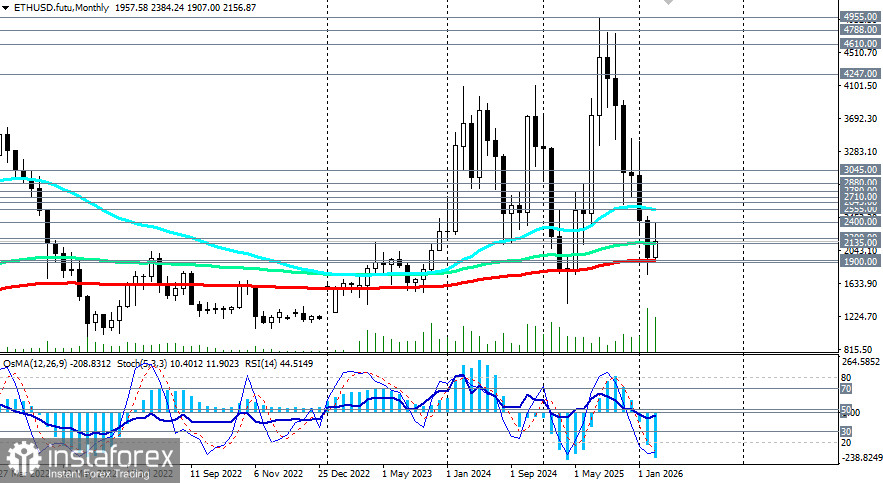
The key zone 2200.00–1900.00 will be the arena of the decisive battle in the coming days. Holding above it will keep chances for a rebound to 2400.00, but a break below will open the road to 1880.00–1800.00, and then to 1500.00.
Under any scenario, volatility will remain high. Investors should closely monitor the development of diplomatic contacts around the Strait of Hormuz and the expiration of large option contracts on Tuesday. The fear and greed index at 32 points indicates the predominance of pessimism, but historically, such levels often precede local reversals, although they do not guarantee the start of a sustained bull trend.


