See also

 24.12.2025 05:18 AM
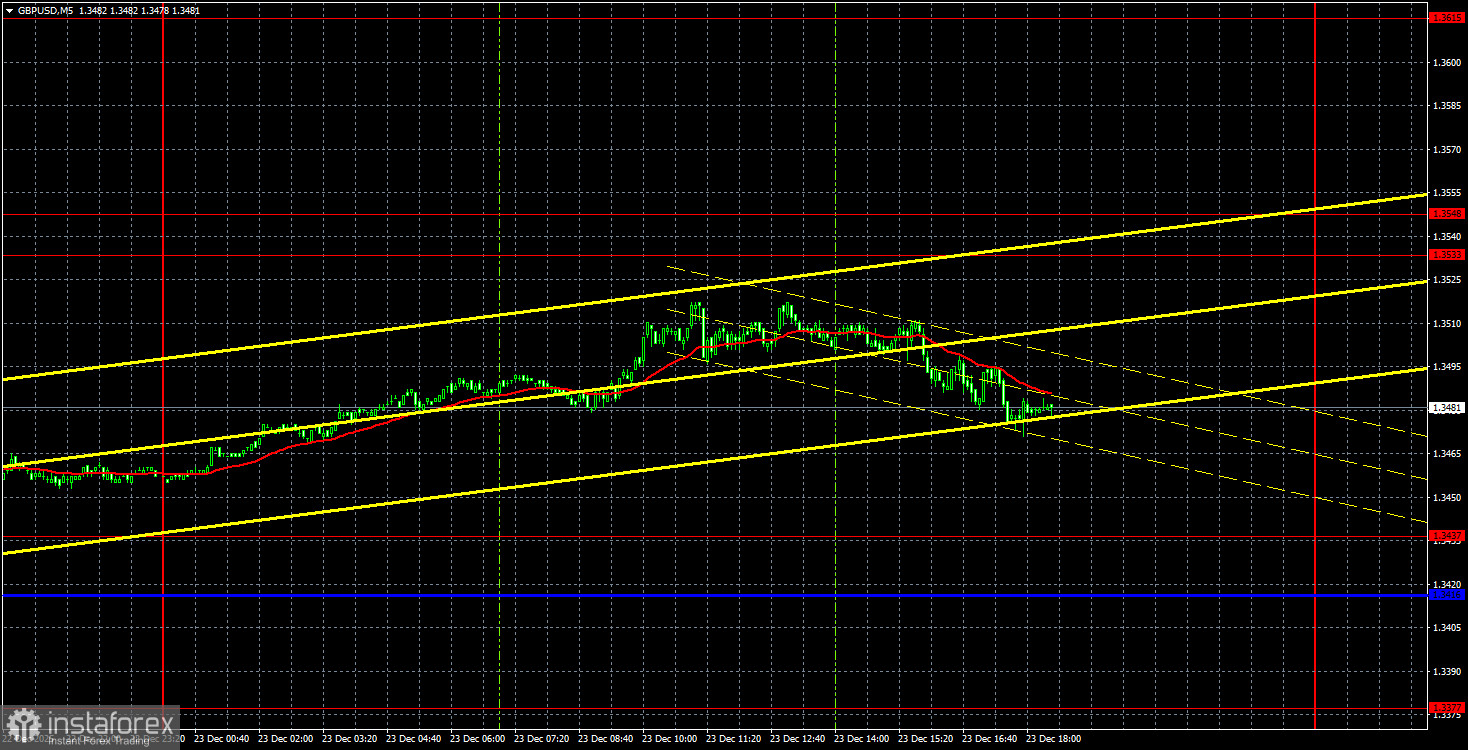
The GBP/USD currency pair continued its upward movement on Tuesday, which seemed to stem from a market decision to actively buy the British currency at the beginning of the Christmas week, rather than any particular economic basis. On Monday, the UK GDP report for the third quarter was released, and it did not surprise anyone, while on Thursday, the US GDP report for the same period was a significant surprise. It was this US GDP report that halted the relentless rise of the British currency; however, we believe this pause will be short-lived. If the market is ready to buy the pair without apparent reasons, it suggests the long-term downward correction on the daily timeframe, which lasted almost 6 months, is likely over.
On Tuesday, the only positive aspect for the dollar was the GDP report. Two other reports—durable goods orders and industrial production—again showed results weaker than forecasts, further pressuring the dollar.
From a technical standpoint, a new ascending trendline was formed on the hourly timeframe. Thus, after a slight correction, upward movement may resume. There are no significant macroeconomic events expected in the US or the UK for the remainder of the week, and Thursday is a market holiday in honor of Christmas.
On the 5-minute timeframe, the last trading signal was generated on Monday when the price broke the 1.3437 level. Traders could have capitalized on this, and on Tuesday, the price came very close to the nearest target area of 1.3533-1.3548—though the US reports got in the way. Nonetheless, the trade could have been closed with a good profit even on Tuesday evening, despite the pullback.
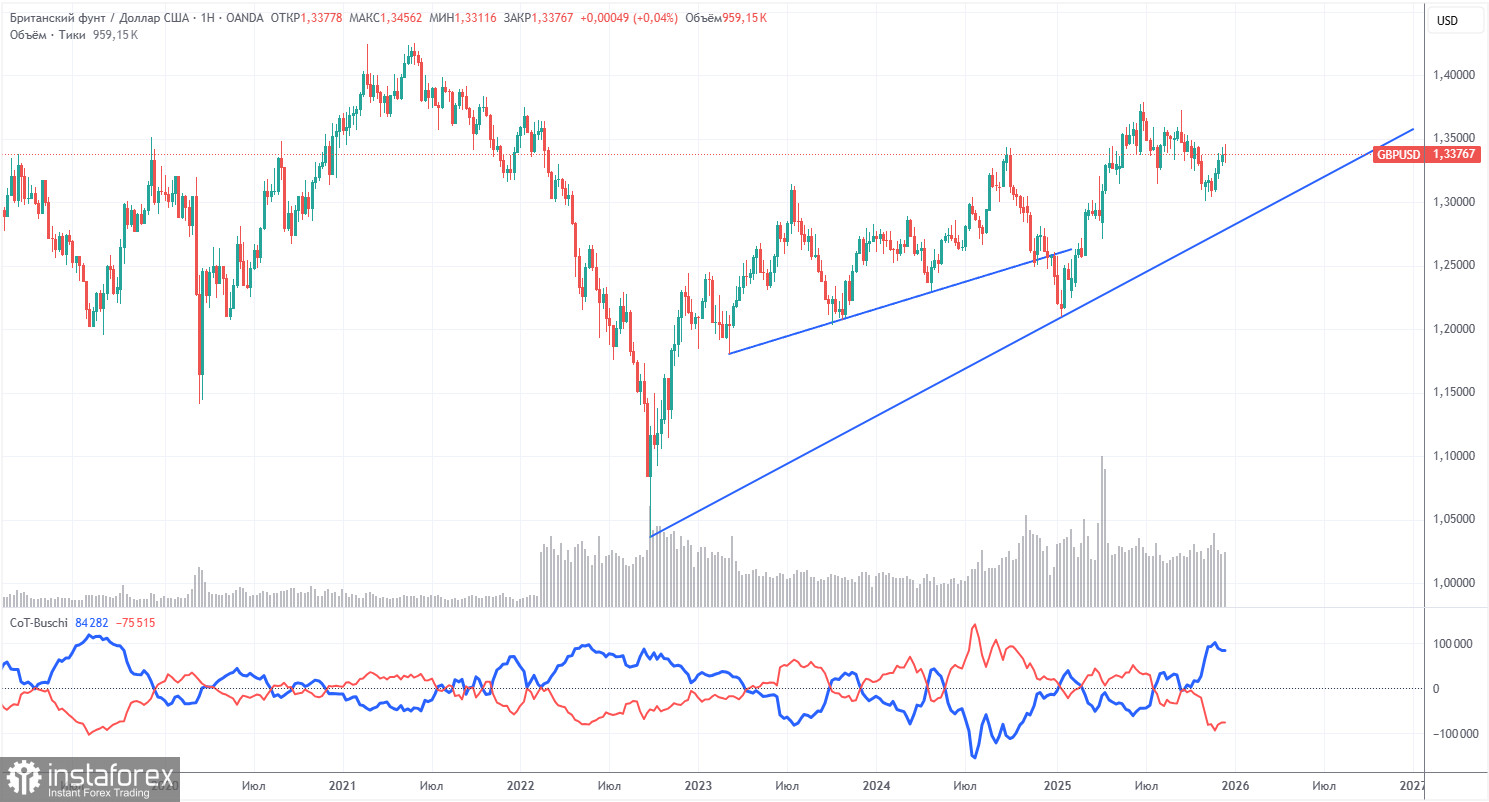
The COT reports for the British pound indicate that traders' sentiment has fluctuated considerably over the past few years. The red and blue lines, representing the net positions of commercial and non-commercial traders, frequently intersect and are generally close to zero. Currently, these lines are moving apart, indicating a dominance of pound buyers. The dollar continues to decline due to Donald Trump's policies, as shown on the weekly timeframe (illustrated). The trade war will continue in one form or another for a long time. The Federal Reserve is set to lower rates in the next 12 months, which will diminish demand for the dollar. According to the latest COT report (dated December 9) for the British pound, the "Non-commercial" group opened 8,000 BUY contracts and 3,400 SELL contracts. Thus, the net position of non-commercial traders increased by 4,600 contracts over the week.
In 2025, the pound has risen significantly, but it is essential to understand that this is due to Trump's policies. Once this factor is neutralized, the dollar may begin to appreciate, but when this will happen is uncertain. Regardless of whether the net position for the pound is rising or falling, the trend for the dollar is invariably downward, usually at a faster pace.

On the hourly timeframe, the GBP/USD pair has exited the sideways channel where it spent the week and has begun the formation of a new upward trend. We believe that the British pound's growth will continue in the medium term regardless of local macroeconomic and fundamental factors. The trend for the pound remains bullish across nearly all timeframes.
For December 24, we highlight the following significant levels: 1.2863, 1.2981-1.2987, 1.3042-1.3050, 1.3096-1.3115, 1.3201-1.3212, 1.3307, 1.3369-1.3377, 1.3437, 1.3533-1.3548, and 1.3584. The Senkou Span B (1.3369) and Kijun-sen (1.3417) lines may also provide signals. It is recommended to set the Stop Loss to break-even when the price advances by 20 pips in the correct direction. The Ichimoku indicator lines may shift throughout the day, which should be taken into account when determining trading signals.
On Wednesday, there are no significant events or reports scheduled in the UK or the US. The upward movement could continue, but new buying signals are needed. Volatility remains low, but there is at least a noticeable good trend movement now.
Today, traders may consider selling if the price bounces off the 1.3533-1.3548 area with a target of 1.3437. Long positions will become relevant if the price consolidates above the 1.3533-1.3548 area, targeting 1.3615, or on a bounce from the 1.3437 level.


