See also

 26.11.2025 10:24 AM
Trend Analysis (Fig. 1).
On Wednesday, from the level of 1.1569 (yesterday's daily candle close), the market may continue moving upward toward 1.1608 — a historical support level (light blue dashed line). Upon testing this level, the price may possibly roll back downward toward 1.1593 — the 61.8% pullback level (blue dashed line).
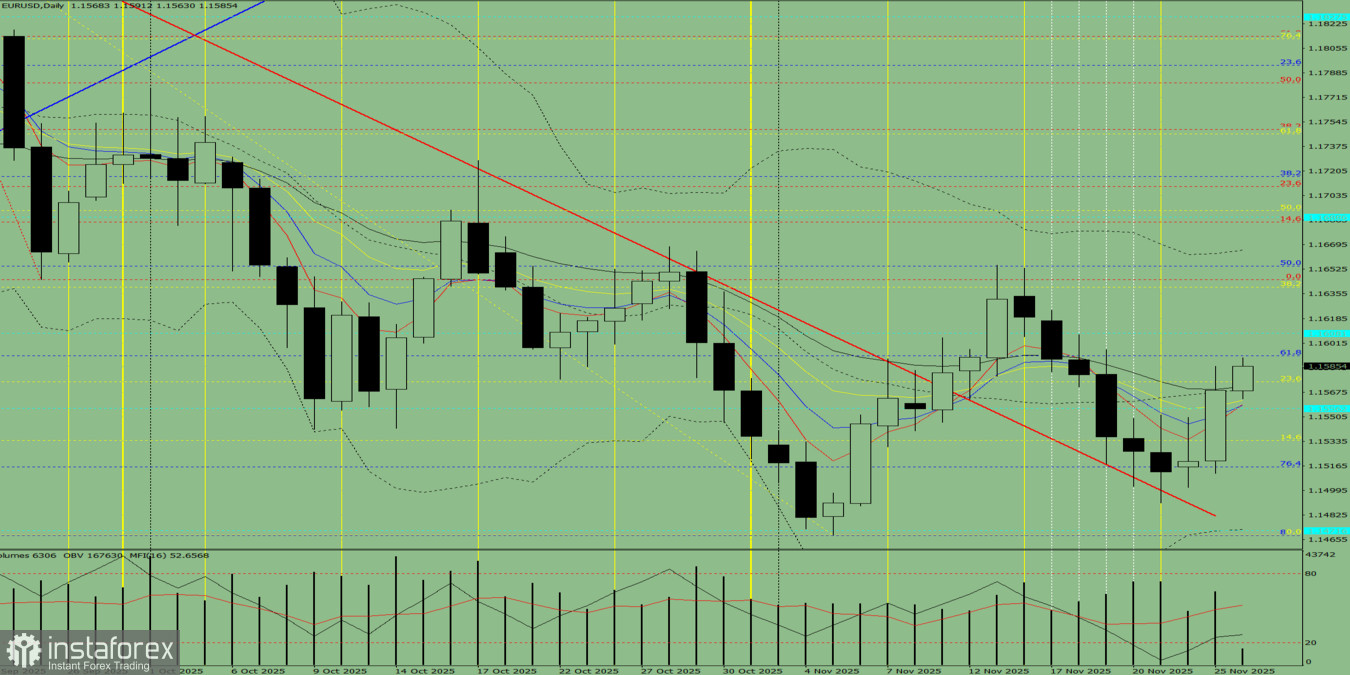
Fig. 1 (daily chart).
Comprehensive Analysis:
Overall conclusion: upward trend.
Alternative scenario: From the level of 1.1569 (yesterday's daily candle close), the price may continue moving upward toward 1.1593 — the 61.8% pullback level (blue dashed line). Upon testing this level, the price may possibly roll back downward toward 1.1575 — the 23.6% pullback level (yellow dashed line).
You have already liked this post today
*The market analysis posted here is meant to increase your awareness, but not to give instructions to make a trade.


